
Actionable Insights
- Which content is most effective for viewer acquisition? For retention? For re-engagement?
- What content should we promote in our marketing and in-app experiences?
- What new content should we produce, license, or acquire?
1.
Content is the lifeblood of every streaming business. Your video library is a huge investment, and a top reason viewers select and stay with your service.
Content performance analytics help you understand how effectively your video assets engage viewers. In addition to identifying the content that resonates with your audience, you can uncover overlooked assets that warrant more promotion and exposure. You can also learn how viewers engage with content across dimensions like time of day, day of the week, device type, audience segment, and geographic region.
Leveraging these insights allows you to make informed marketing, programming, and investment decisions that maximize the value you and your audience derive from your content catalog.

Grow your audience by marketing content that draws a crowd. Showcasing popular, high-profile shows is a no-brainer. But you can also find new promotional opportunities by identifying the titles that drive the most trials and the shows that new viewers watch first. In addition, you can mine your catalog for hidden gems with a groundswell of viewer support.

You’ve captured viewers’ attention, but do you have enough of the right content to keep them coming back? Use content analytics to determine which genres, series, or titles are the biggest drivers of long-term engagement. Then make content investment decisions confident that you are increasing monetization opportunities and the stickiness of your service.

Engage your audience with relevant viewing suggestions. Leverage content insights to determine the most popular and promotable segments of your library and to find the triple-A assets that consistently deliver happy viewers. You can also make targeted recommendations by identifying “dynamic duos,” where fans of show A tend to heavily engage with show B.
| METRIC | WHY IT MATTERS |
|---|---|
Attention Index |
Attention index compares the number of satisfied viewers (who tend to watch a given video to completion) with the number of dissatisfied viewers (who tend to drop off early). See how your content strategy drives audience engagement by tracking attention index by asset, genre, channel, and more. |
Service Share |
Service share functions like a Nielsen rating for your service. The metric surfaces content that draws an outsized (or undersized) audience by calculating how much of the overall viewing time was spent with a specific media asset. |
First Watched |
These are the shows new viewers watch first. Understanding first-watched content helps you identify the programs that can attract new audiences and trial sign-ups. |
Viewing Volume |
Video viewing metrics offer actionable insights into the health of your content library. Determining which videos drive highly engaged viewing minutes can also inform your content and programming decisions. |
Device Usage |
Understanding content consumption patterns by device—including viewing time and content preferences—can help you prioritize app enhancements and evaluate their contribution to business growth. |
2.
Whatever your business model, understanding how your audience interacts with your service is essential for effective media monetization. Audience engagement insights give you an objective view of your business over time. Is the number of active viewers growing? How many viewers are at risk of churning? Are hours viewed going up or down? You can also use engagement insights to segment and communicate with viewers in more meaningful ways, across the entire audience lifecycle. For example, you can differentiate between new, engaged, and lapsed users and run targeted campaigns for onboarding, retention, and re-engagement.

Break the binge-and-burn cycle by extending your onboarding flow with personalized content recommendations. Match viewers with the right content by making relevant “what to watch next” suggestions and promoting new shows in the genres they watch most. You can also introduce viewers to content in adjacent genres, so they get value from a bigger part of your library.

There is no greater predictor of potential audience churn than frequency of use. Viewers who haven’t engaged with your service recently or regularly are significantly more likely to leave. With actionable data on audience engagement, you can take proactive, automated actions to re-engage at-risk viewers using new content, offers, or service features.

Use engagement insights to create meaningful segments of lost viewers, then lure them back with targeted offers. For example, you might pitch a discounted annual subscription to frequent churners or entice previously engaged viewers with new releases in their favorite genre. Track your results so you know which lost viewer segments to prioritize and when to cut your losses.
| METRIC | WHY IT MATTERS |
|---|---|
Audience Engagement |
Audience engagement metrics provide insights into the health of your service. They also help you understand your audience’s viewing patterns, including how often viewers engage, how much they engage, and the devices they engage on. |
Engagement Status |
Dividing viewers into cohorts based on their engagement level allows you to grow your business with targeted outreach strategies. Common audience cohorts include new, engaged, re-engaged, recent, idle, and dormant. |
Usage Trends |
Trends in audience engagement help you gauge the impact of such milestone events as launching on a new platform or releasing new content. Usage trends by device, region, and viewer cohort offer rich insights for tracking progress against business decisions. |
Active Viewers |
What percentage of viewers are actively engaged with your service? If a significant percentage haven’t signed in within the last 30 days, then new investments in audience engagement and retention may be needed. |
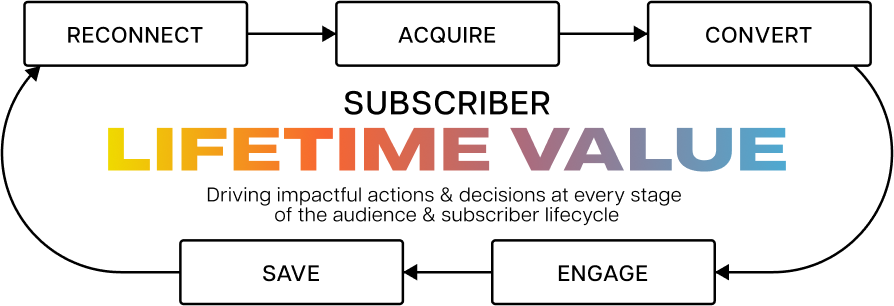
3.
Building a sustainable subscription video service requires intelligent management of the subscriber throughout the subscriber lifecycle. A healthy subscription service evolves over time, and as growth rates slow, it is imperative that appropriate focus be given to retention, re-engagement, churn mitigation, and win-back strategies. Understanding and executing the right approach for each stage in the subscriber lifecycle yields significant value, including more revenue and happier subscribers.

Increase the efficiency and effectiveness of subscriber acquisition with a solid understanding of the pricing plans, marketing channels, content promotion, and trial offers that drive new registrations.

Every SVOD service should understand their retention curves and churn dynamics. Prioritize audience engagement strategies with insights into subscriber lifetime value, average revenue per subscriber, and the plans, devices, regions, and channel partners with the best retention rates.

Most SVOD services offer subscription plans through multiple channels. You can optimize this distribution strategy when you understand the contribution each channel makes to your business. In addition, a per-partner view of sign-ups, engagement, and churn rates allows you to align promotion, retention, and win-back campaigns appropriately.
| METRIC | WHY IT MATTERS |
|---|---|
Subscriber Lifetime Value (SLV) |
This is the ultimate measure of SVOD success. Tracking subscriber lifetime value over time and understanding what causes SLV to change is key to growing a healthy SVOD service. |
Subscriber Tenure |
Subscriber tenure is tightly correlated with subscriber lifetime value. You can maximize revenue by understanding what compels subscribers to stay and how changes to your service affect subscriber tenure. |
Trial Performance |
Being able to test and measure trial performance helps marketing teams improve subscriber acquisition. By monitoring trial signups and conversions, marketers can zero in on the models, messages, and offers that drive subscriber growth. |
Subscription Plan Performance |
Many SVOD services are adding new subscription tiers, including free or low-cost ad-supported plans and premium plans with enhanced video or audio quality. Understanding how these plans perform and contribute to subscriber lifetime value is essential for validating these strategies. |
Conversion Rates |
Conversion rates are critical indicators of success across the subscriber journey. You can gauge the effectiveness of new content, subscription tiers, and other SVOD service milestones by monitoring conversion rates for trials, retention, upgrades, win-back campaigns, and more. |

Smart data use requires the right tools and expertise. To transform video data into actionable business insights, look for a streaming solution that:
4.
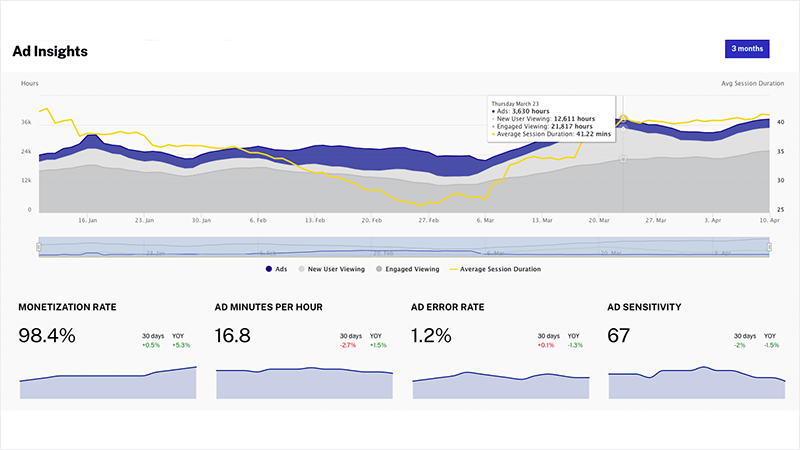
If you’ve ever abandoned a video (or streaming service) because you were frustrated by the number of ads, you understand the importance of balancing revenue generation with audience experience. Sure, you want to make as much money from ads as possible. But not at the expense of losing viewers.
Companies with an ad-supported business—whether AVOD or AVOD + SVOD—can optimize their ad strategy with insights into their audience’s ad sensitivity. Top-tier streaming platforms allow you to see how viewer engagement is affected by ad policies, including the number of ad breaks and where they’re placed. With these actionable insights, you can zero in on a strategy that maximizes ad revenue while ensuring a quality experience for viewers.

Use viewer engagement metrics to optimize ad placement by content duration. Video completion rates often show a steep drop off in viewers at the beginning of short-form content. So, mid-roll or post-roll ads work best for videos up to ten minutes long. On the other hand, audiences tend to be more tolerant of pre-roll ads when settling in to watch a 90-minute movie.

Determine the optimal number and duration of ad breaks by gauging the impact of ad load on Attention Index. (A higher Attention Index indicates that fewer viewers are abandoning your content.) This allows you to strike the right balance between monetizing your media and keeping your audience engaged. Striking the right balance enables you to maximize ad revenue per minute within a viewing session.
| METRIC | WHY IT MATTERS |
|---|---|
Attention Index |
Advertiser value is lost when viewers tune out. Attention Index helps you increase advertising effectiveness by providing insights into which content viewers are paying attention to and how long they remain engaged. |
Ad Sensitivity |
Ad sensitivity is a measurement of the optimal number of ad breaks, the quantity and length of ad pods, and the various playback conditions that minimize ad abandonment. You can increase ad yield with an understanding of how ad sensitivity varies by content, device, region, and more. |
Interest Phase |
Interest phase is helpful for establishing ad placement policies that limit viewer abandonment. It allows you to identify where within your content a viewer is most likely to disengage if ads are trafficked. |
Ad Minutes Per Hour |
Track ad minutes per hour to identify untapped revenue opportunities as you dial in the right ratio of ads to content. |
Average Session Duration |
Insights into average session duration help you assess the impact of ad strategy changes on viewer engagement. |
5.
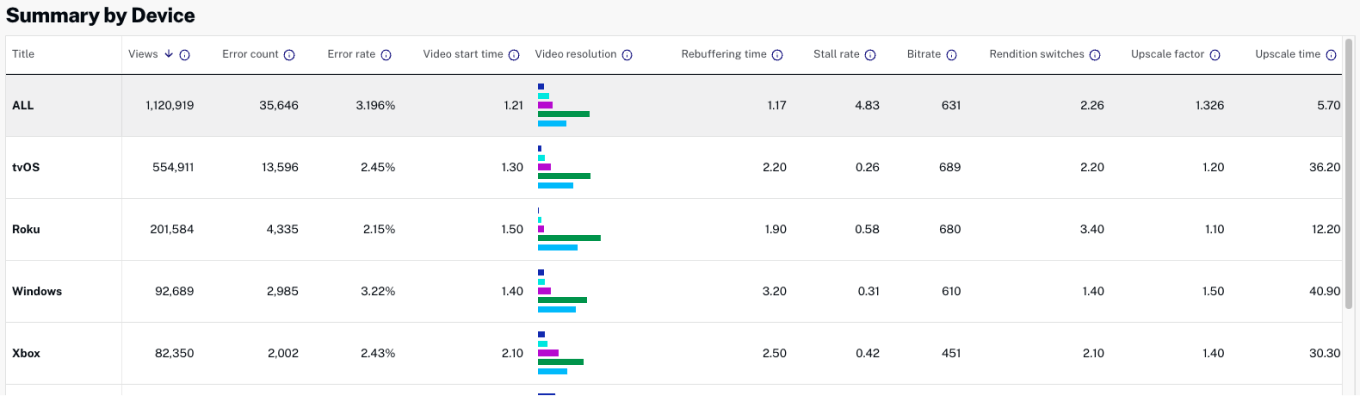
What do viewers experience when they stream your content? Does the video start instantly? Is the picture crisp and clear? Is playback smooth, without skips or stalls? The answers to these questions affect your ability to grow a loyal audience and, therefore, your monetization potential.
Quality of Experience (QoE) insights help you assess the viewing experience from your audience’s perspective. You can ensure a positive streaming experience every time viewers hit play by using QoE insights to:
In addition, leading streaming platforms correlate QoE metrics with audience engagement and retention. This allows you to prioritize actions that impact revenue the most.

Updating your apps can be a great way to enhance the viewer experience. But it can also introduce unexpected problems. After an update, you might see a sudden spike in load time or error rate. By keeping tabs on QoE metrics by device type (Apple mobile, Android mobile, Windows desktop, etc.), you can spot any emerging issues and quickly release a fix.

Use QoE metrics to ensure a consistently good experience in every region you operate. For example, suppose you need to switch your content delivery network (CDN) to support growth in the Asian market. To ensure a smooth transition for local viewers, you can track streaming performance before and after the change and compare it to benchmarks set in other regions.
Many media companies use context-aware encoding (CAE) to reduce streaming and storage expenses. By monitoring QoE metrics, you can ensure that this cost-saving measure doesn’t diminish the viewer experience. In many cases, smart dynamic coding profiles can reduce both delivery costs and the stream disruptions that impair service performance.
| METRIC | WHY IT MATTERS |
|---|---|
Video Start Time |
Video start time is one of the biggest predictors of sustained viewership. Shortening video start times positively impacts video engagement and monetization. |
Stall Rate |
The lower the stall rate, the better the viewer experience. Video ops teams can prioritize where they spend their time and resources when they know which content, devices, regions, or players are experiencing higher stall rates. |
Error Rate |
A failed video playback is a significant event. High error rates generally indicate a systemic incompatibility, such as unsupported devices connecting to your streams. |
Upscaling Time |
Upscaling occurs when a video rendition is streamed at a lower resolution than the playback device can display, often resulting in fuzziness or pixelation. High upscaling time can lead to a poor viewer experience and disengagement. |
QoE Score |
Reporting on overall QoE performance helps video ops gauge how viewers experience your content and how milestone events—such as changes to encoding parameters or a new CDN partner—affect QoE metrics over time. |
QoE Tolerance |
Understanding your audience’s tolerance for QoE impairments allows your video ops team to focus their efforts on the factors that have the greatest impact on viewer experience and monetization potential. |
6.
A data-driven strategy can set your service apart from competitors and on a path to greater profitability.
When you have a streaming platform with robust analytics and insights, you can understand what your audience wants, find new opportunities for engagement, deliver the best viewing experience, and maximize the revenue generated with your content library.