Earning trust is at the core of Brightcove’s efforts to grow our leadership position in the streaming technology industry. That’s why we launched QoE Analytics, a suite of features focused specifically on Quality of Experience (QoE). There’s no better way to build trust with our customers than helping them monitor our performance in the arena where it matters most: the viewing experience.
WHY MONITOR QOE?
Quality of Service (QoS) and QoE are often lumped together, which can seem like a lot for many media companies to take on, both in complexity and cost. However, they are fundamentally different. QoS focuses on key network performance metrics at an operations level, while QoE provides a sense of the viewing experience from a user perspective.
We believe that QoE is more meaningful and often more actionable for most media companies, given the direct correlation to user satisfaction.
WHAT QOE METRICS ARE IMPORTANT?
Brightcove collects a massive amount of data on behalf of our customers. This allowed us to narrow our QoE measurements down to the ones with the most significant correlations. We then cross-checked these findings with our own research team as well as several leading media companies who have studied this carefully. Based on this, we believe the following four metrics are the most important to track over time.
1) VIDEO START TIME
Video start time measures the average number of seconds elapsed between the play request and the stream start. High start times correlate with abandonment before streaming even starts and can indicate issues with the CDN, player plug-ins, and initial stream bitrate where intervention makes sense. Low video start times mean your audience is watching video quickly, which is what they expect.
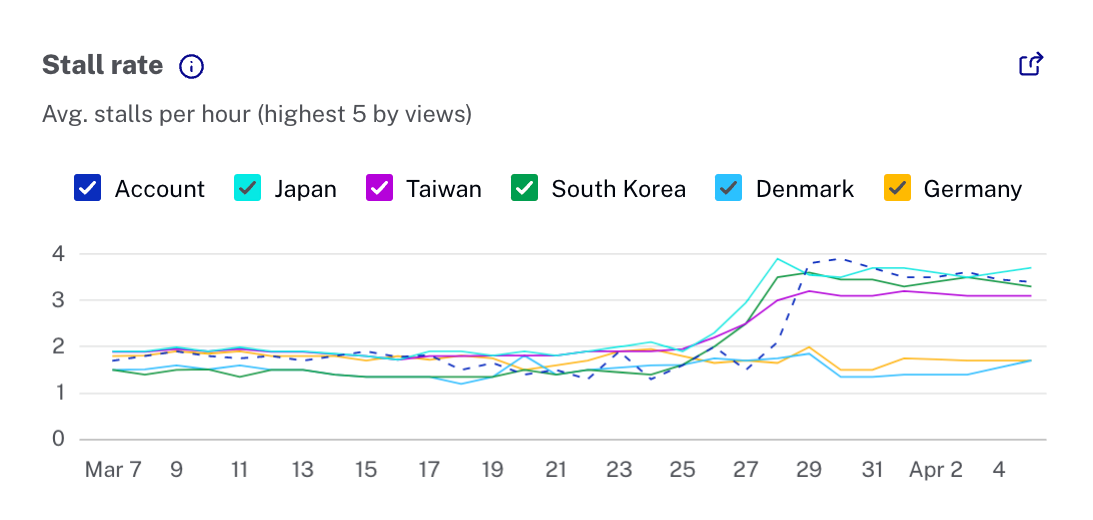
2) STALL RATE
Stall rate is the average number of stalls per hour, calculated by comparing total stalls to total hours viewed in the selected time range. Unlike other rebuffering events, video stalls directly affect playback. This can manifest as single stalls of significant length or frequent stalls of varying length. Thus, a low stall rate means smoother playback and a better viewer experience.
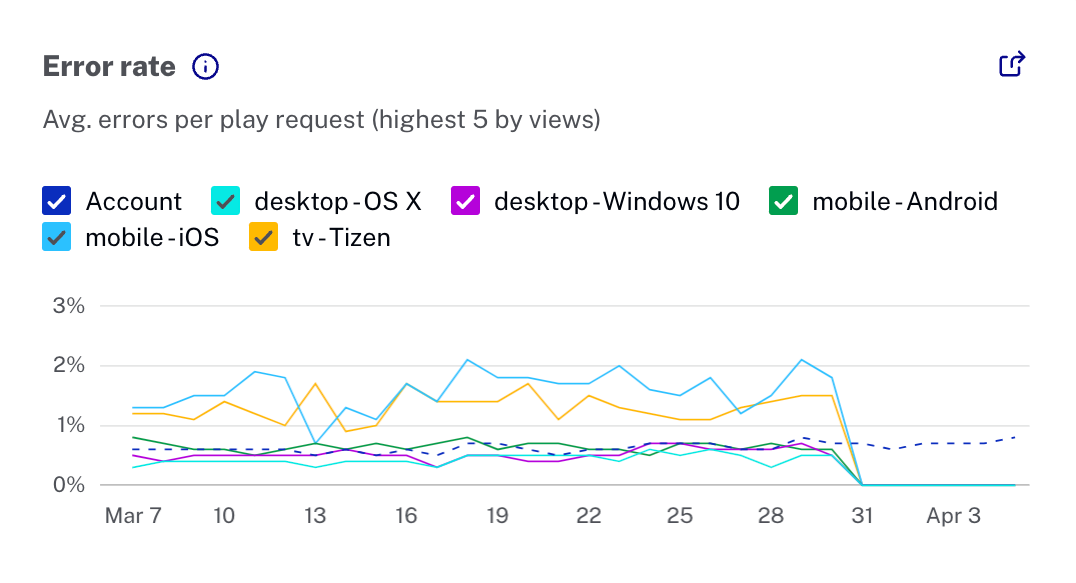
3) ERROR RATE
Error rate is the percentage of all play requests with errors preventing playback (as opposed to background errors the viewer doesn’t notice). These errors typically occur before playback begins, but they can also happen during playback. Low error rates mean that customers are usually able to watch the content they select.
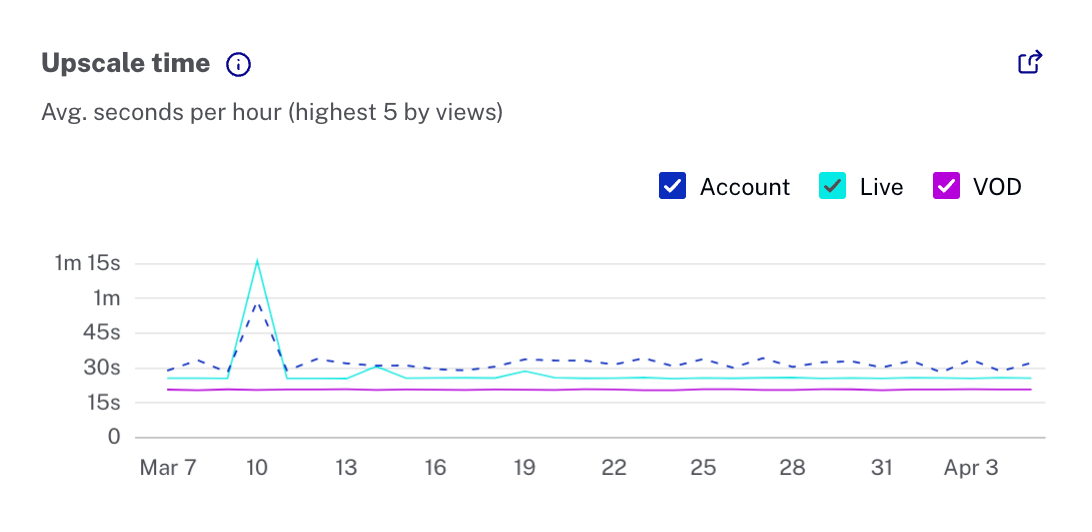
4) UPSCALING TIME
Upscaling time measures the average number of seconds per hour of viewing that is spent in an upscaled state. Upscaling occurs when a video rendition is streamed at a lower resolution than the playback device can display, often resulting in fuzziness or pixelation. This is particularly noticeable when a lower resolution stream is played on a large-screen device. Low upscaling time generally means your viewers are enjoying smooth, crisp video playback.
While upscaling time is critical in monitoring quality of experience, there are times when it may not affect the viewer. For example, upscaling often happens when high resolution content is streamed to a 4K TV but not encoded at 4K. Since most viewers won’t notice this, it’s important to dig into the data to determine the reasons behind low upscaling times.
WHAT DIMENSIONS AFFECT QOE?
QoE metrics can be affected by a number of different factors, from mobile app updates to content delivery network (CDN) changes. Breaking down those metrics by different dimensions makes it easy to compare performance and identify issues and opportunities.
DEVICE TYPE
Looking at metrics by device category allows you to see device-specific issues and trends over time. The imaginary example below shows a spike in error rate for Android devices that could be correlated to a recent app update.

STREAM TYPE
By comparing the QoE metrics of VOD against livestreams, you can isolate mode-specific issues or trends. In the fictional example below, there was a jump in upscaling around a live event that resolved quickly.

PLAYER
Looking at QOE metrics broken out by player is a great way to isolate player-specific issues. For example, there can be significant differences in load time, depending on the plugins that load at play request. There can also be issues in specific players that result in increased error rates. Seeing these differences makes them easier to isolate and act on.
COUNTRY
For customers who operate internationally, viewing QoE metrics by country can assist in isolating regional issues. Imagine a media company adopted a new content delivery network for their Asian consumers. From the example below, it’s clear that the CDN underperformed when looking at the stall rate.

QOE ANALYTICS IN CONTEXT
To properly track trends, it’s also important to see metrics and dimensions in context with each other. For example, Brightcove’s QoE solution not only provides charts for each metric, it includes a table with all metrics for a more comprehensive view. In addition to the key metrics, it also includes view count, video resolution breakdown, rebuffering time, and average bitrate for additional context.
The table is sortable by any of the columns and responsive to dimension selection, making it easy to explore and identify outliers. In the fictional example below, the device dimension was selected.

QUALITY OF EXPERIENCE YOU CAN TRUST
On most days, Quality of Experience reporting will be a testament to the high quality video streaming that Brightcove is known for. However, issues can arise and we want to ensure that we’re helping our customers see them. This is a big step forward in our mission to be the most trusted streaming technology company in the world.


