
In this article, we will introduce the Live Analytics feature that was released in June 2019.
This feature has been requested by many users for some time, and it has finally been implemented in Brightcove Live.
To explain this feature briefly, you can check metrics specific to Live broadcasts (such as the number of concurrent viewers and trends) during and after a Live broadcast. Let’s check out the feature right away.
## Introduction
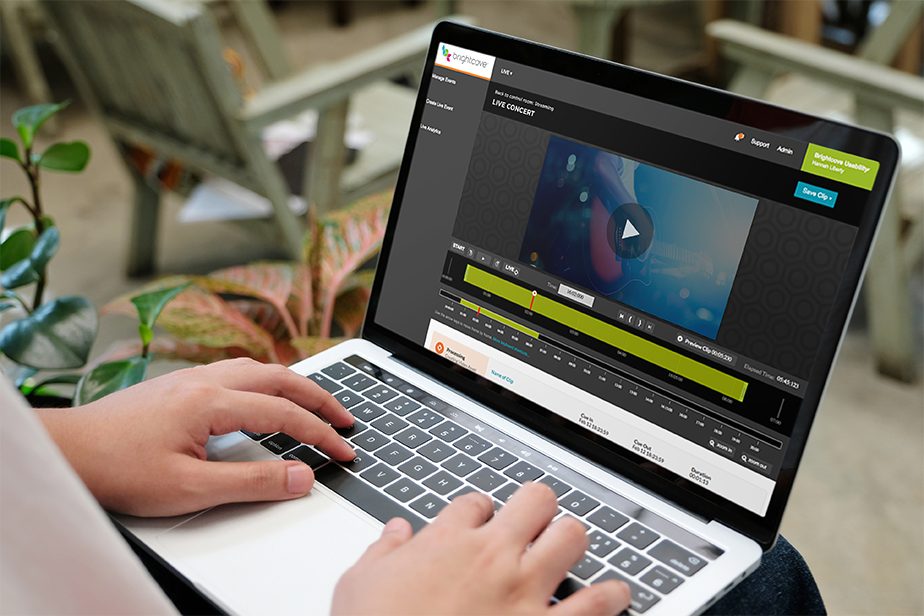
The usage method is very simple. If you are going to hold a Live event for the first time, please go to the Control Room while checking [this](https://ja.live.support.brightcove.com/live-module/creating-and-managing-live-events-using-live-module.html “this”). For recurring events, please refer to [this](https://ja.live.support.brightcove.com/live-module/creating-and-managing-live-events-using-live-module.html “this”) and transition to the control room.
When you transition to the new page, you will see a tab at the bottom of the page labeled ‘Reporting’ (the English version is a little cute, as of June 17, 2019).
This is the Live Analytics function, and we will explain each of the analysis items from the top down.
## SNAPSHOT
The following items can be checked at a glance in this section during a Live broadcast. Snapshots are updated every minute.
– __Total Views:__ Total number of views during the Live broadcast
– __Unique Viewers:__ Total number of unique viewers
– __Avg View Time:__ Average viewing time
– __Total Viewed Minutes:__ Total viewing time
– __Ad Starts:__ Number of ad plays
In addition to the above, there is also an item called ‘Concurrent Viewers’.
Cumulative Views This is a notable feature of the update, as it allows you to check not only the cumulative number of views, but also the number of concurrent viewers during a Live event.
## VIEWS BY DEVICE
VIEWS BY DEVICE allows you to check which devices are being used to view your Live stream. In the example above, you can see that there were 3 views from desktop devices and 1 view from a mobile device. In addition to desktop and mobile, you can also analyze the number of views from tablets, TVs and game consoles.
## VIEWS BY COUNTRY
VIEWS BY COUNTRY allows you to see which countries your viewers are coming from. In the example above, you can see that there were 4 views from Japan.
## For recurring events
If you are using a recurring event, the date and time will be listed at the top of the Reporting page. Clicking on this will allow you to select past recurring Live events, and you can check the Live analytics for past events. Please note that analytics data can only be viewed for 32 days after the event has ended, so we recommend exporting the data as necessary.
## Finally
Sports programming using live streaming. Video marketing and live commerce. And internal communication using live streaming. The need for live streaming is increasing every year. Why not improve the structure and content of your live streaming by analyzing how it was viewed?
Notes:
This Live Analytics feature uses the video player tag for Live distribution issued from the Video Cloud Live module to reflect data. Please note that the Live Analytics feature cannot be used for Live distribution using remote assets.


