Qoe Actionable Video Streaming
Media
Analytics
Video Playback
비디오 스트리밍을 위한 QOE 실행 가능 만들기
Apr 14, 2023
경험의 질은 비즈니스 목표에 측정 가능한 영향을 미칩니다. 적절한 도구를 사용하면 이러한 분석을 행동으로 전환할 수 있습니다.
브라이트코브는 스트리밍 기술 업계에서 선도적인 입지를 다지기 위해 신뢰를 얻는 것이 핵심입니다. 이것이 바로 브라이트코브가 체감 품질 (QoE)에 특별히 초점을 맞춘 기능 모음인 QoE 애널리틱스를 출시한 이유입니다. 가장 중요한 분야인 시청 경험에서 성능을 모니터링하는 것보다 고객과의 신뢰를 구축하는 더 좋은 방법은 없습니다.
왜 QOE를 모니터링해야 할까요?
서비스 품질(QoS)과 QoE는 종종 한데 묶여 많은 미디어 회사가 복잡성과 비용 측면에서 부담스러워할 수 있습니다. 하지만 이 둘은 근본적으로 다릅니다. QoS는 운영 수준에서 주요 네트워크 성능 지표에 초점을 맞추는 반면, QoE는 사용자 관점에서 시청 경험에 대한 감각을 제공합니다.
사용자 만족도와 직접적인 상관관계를 고려할 때, 대부분의 미디어 회사에서 QoE가 더 의미 있고 실행 가능한 경우가 많다고 생각합니다.
어떤 QOE 지표가 중요하나요?
브라이트코브는 고객을 대신하여 방대한 양의 데이터를 수집합니다. 이를 통해 가장 중요한 상관관계가 있는 측정값으로 QoE 측정 범위를 좁힐 수 있었습니다. 그런 다음 자체 연구팀과 이를 면밀히 연구한 여러 주요 미디어 회사와 함께 이러한 결과를 교차 확인했습니다. 이를 바탕으로 다음 네 가지 지표가 시간이 지남에 따라 가장 중요하게 추적해야 할 지표라고 판단했습니다.
1) 동영상 시작 시간
동영상 시작 시간은 재생 요청과 스트림 시작 사이의 평균 경과 시간(초)을 측정합니다. 시작 시간이 길면 스트리밍이 시작되기도 전에 시청을 포기하는 것과 관련이 있으며, CDN, 플레이어 플러그인, 초기 스트림 비트레이트에 문제가 있어 개입이 필요한 상황일 수 있습니다. 동영상 시작 시간이 짧다는 것은 시청자가 동영상을 빠르게 시청하고 있다는 것을 의미합니다.
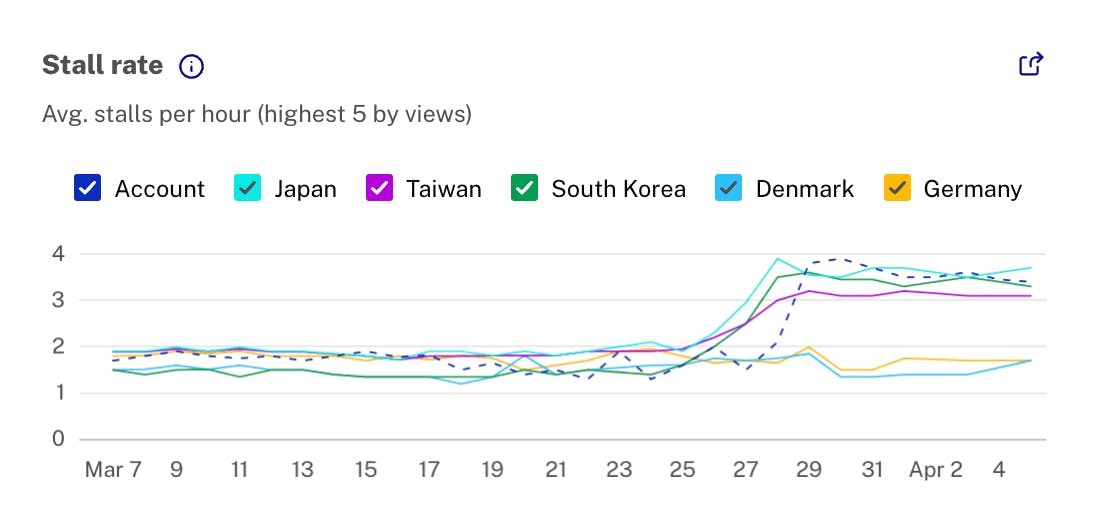
2) 스톨 요금
시간당 평균 재생 중단 횟수는 총 재생 중단 횟수와 선택한 시간 범위의 총 시청 시간을 비교하여 계산한 값입니다. 다른 리버퍼링 이벤트와 달리 동영상 멈춤은 재생에 직접적인 영향을 미칩니다. 이는 상당한 길이의 단일 스톨 또는 다양한 길이의 빈번한 스톨로 나타날 수 있습니다. 따라서 중단률이 낮을수록 재생이 원활하고 시청자 경험이 향상됩니다.
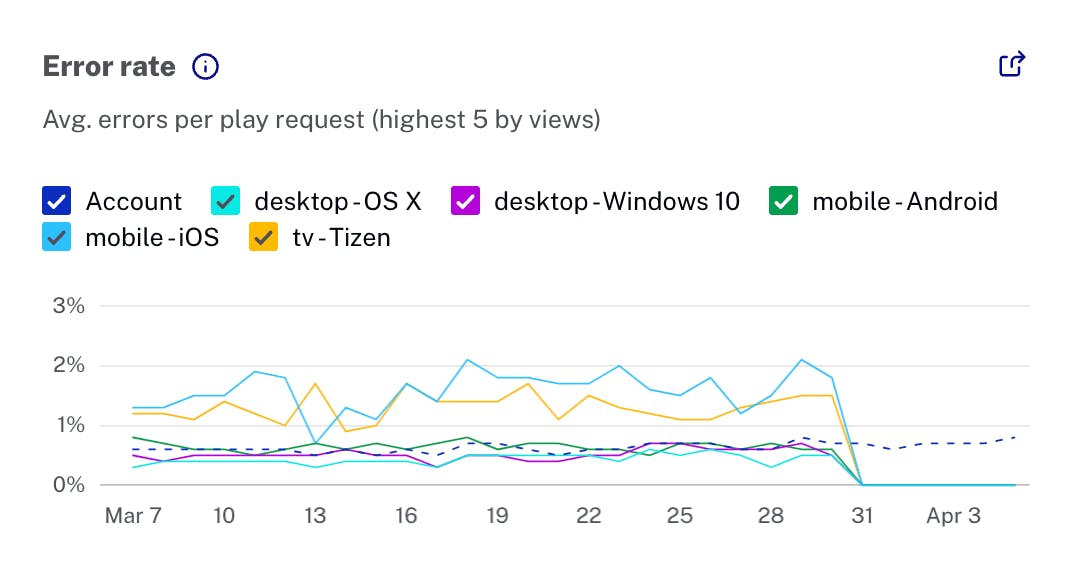
3) 오류율
오류율은 재생을 방해하는 오류가 있는 모든 재생 요청의 백분율입니다(시청자가 인지하지 못하는 백그라운드 오류와는 반대). 이러한 오류는 일반적으로 재생이 시작되기 전에 발생하지만 재생 중에도 발생할 수 있습니다. 오류율이 낮다는 것은 일반적으로 고객이 선택한 콘텐츠를 시청할 수 있다는 것을 의미합니다.
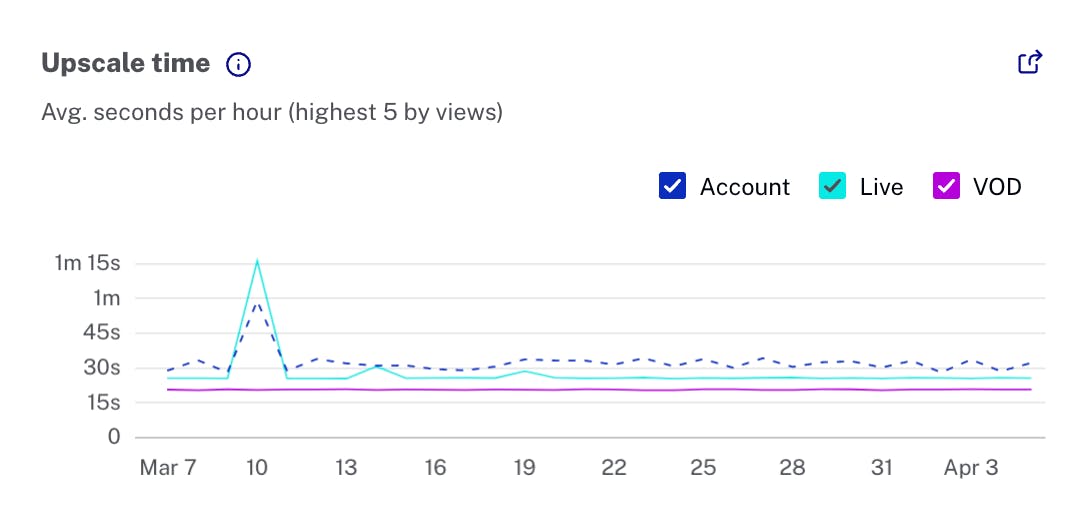
4) 업스케일링 시간
업스케일링 시간은 업스케일링 상태로 시청하는 데 소요되는 시간당 평균 시간(초)을 측정합니다. 업스케일링은 동영상 렌더링이 재생 디바이스가 표시할 수 있는 해상도보다 낮은 해상도로 스트리밍될 때 발생하며, 종종 흐릿함이나 픽셀화가 발생합니다. 이는 특히 저해상도 스트림이 대형 화면 디바이스에서 재생될 때 두드러지게 나타납니다. 일반적으로 업스케일링 시간이 짧다는 것은 시청자가 부드럽고 선명한 동영상 재생을 즐기고 있다는 의미입니다.
업스케일링 시간은 화질 모니터링에 매우 중요하지만, 시청자에게 영향을 미치지 않는 경우도 있습니다. 예를 들어 고해상도 콘텐츠가 4K TV로 스트리밍되지만 4K로 인코딩되지 않은 경우 업스케일링이 발생하는 경우가 종종 있습니다. 대부분의 시청자는 이를 알아차리지 못하므로 데이터를 자세히 분석하여 업스케일링 시간이 짧은 이유를 파악하는 것이 중요합니다.
QOE에 영향을 미치는 차원은 무엇인가요?
QoE 지표는 모바일 앱 업데이트부터 콘텐츠 전송 네트워크(CDN) 변경에 이르기까지 다양한 요인에 의해 영향을 받을 수 있습니다. 이러한 지표를 다양한 차원으로 분류하면 성능을 쉽게 비교하고 문제와 기회를 파악할 수 있습니다.
장치 유형
디바이스 카테고리별로 메트릭을 살펴보면 시간 경과에 따른 디바이스별 문제와 추세를 확인할 수 있습니다. 아래 가상의 예는 최근 앱 업데이트와 관련이 있을 수 있는 Android 디바이스의 오류율 급증을 보여줍니다.
스트림 유형
VOD의 QoE 지표를 라이브 스트리밍과 비교하여 모드별 문제나 추세를 파악할 수 있습니다. 아래 가상의 예시에서는 라이브 이벤트를 중심으로 업스케일링이 급증했지만 빠르게 해결되었습니다.
플레이어
플레이어별로 세분화된 QOE 지표를 살펴보면 플레이어별 문제를 분리할 수 있는 좋은 방법입니다. 예를 들어, 플레이 요청 시 로드되는 플러그인에 따라 로드 시간에 상당한 차이가 있을 수 있습니다. 특정 플레이어에서 오류율이 증가하는 문제가 있을 수도 있습니다. 이러한 차이를 확인하면 문제를 더 쉽게 격리하고 조치할 수 있습니다.
국가
해외에서 사업을 운영하는 고객의 경우 국가별 QoE 지표를 확인하면 지역별 문제를 파악하는 데 도움이 될 수 있습니다. 한 미디어 회사가 아시아 소비자를 위해 새로운 콘텐츠 전송 네트워크를 도입했다고 가정해 보겠습니다. 아래 예시를 보면 CDN의 성능 저하를 확인할 수 있습니다.
맥락에 맞는 QOE 분석
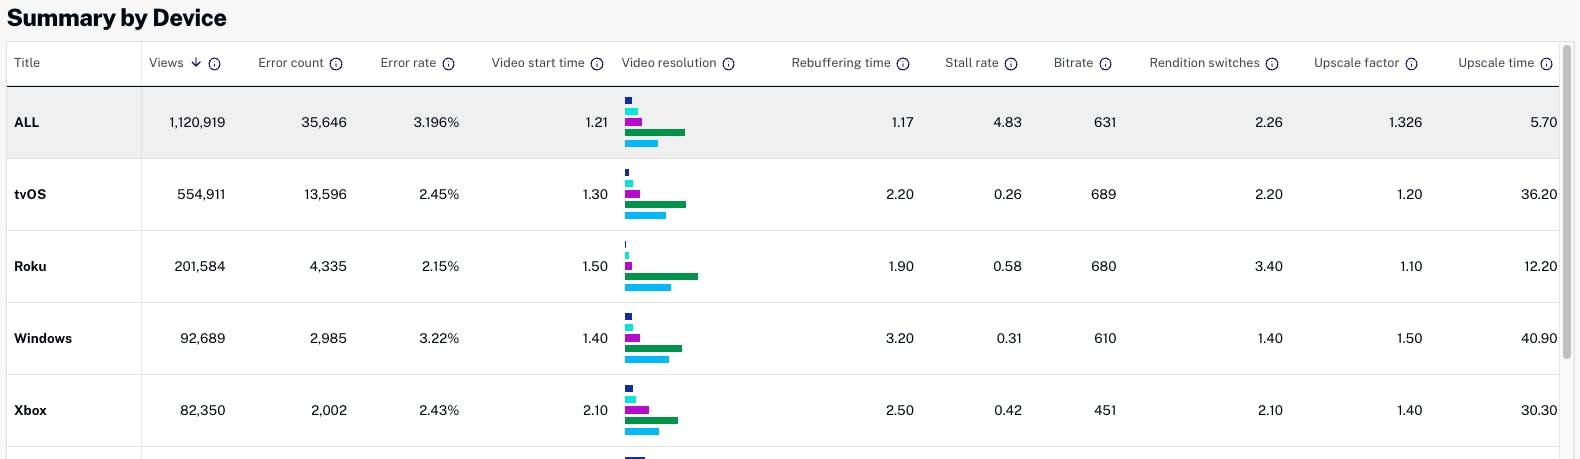
추세를 제대로 추적하려면 메트릭과 차원을 서로의 맥락에서 보는 것도 중요합니다. 예를 들어, 브라이트코브의 QoE 솔루션은 각 지표에 대한 차트를 제공할 뿐만 아니라 모든 지표가 포함된 표를 제공하여 보다 포괄적인 시각을 제공합니다. 주요 지표 외에도 추가적인 컨텍스트를 위해 조회 수, 비디오 해상도 분석, 리버퍼링 시간, 평균 비트레이트도 포함됩니다.
테이블은 열을 기준으로 정렬할 수 있고 차원 선택에 따라 반응하므로 이상값을 쉽게 탐색하고 식별할 수 있습니다. 아래 가상의 예에서는 기기 차원을 선택했습니다.
신뢰할 수 있는 경험의 품질
대부분의 경우, 체감 품질 보고는 브라이트코브의 고품질 비디오 스트리밍을 입증하는 증거가 될 것입니다. 하지만 문제가 발생할 수 있으며, 브라이트코브는 고객이 이러한 문제를 해결할 수 있도록 돕고자 합니다. 이는 세계에서 가장 신뢰받는 스트리밍 기술 기업이 되고자 하는 브라이트코브의 사명에서 큰 진전입니다.