
This time, we will be describing how to check the number of views, CDN traffic (video bandwidth), and Live module time in Video Cloud, which underwent a major renewal of its management screen in 2015.
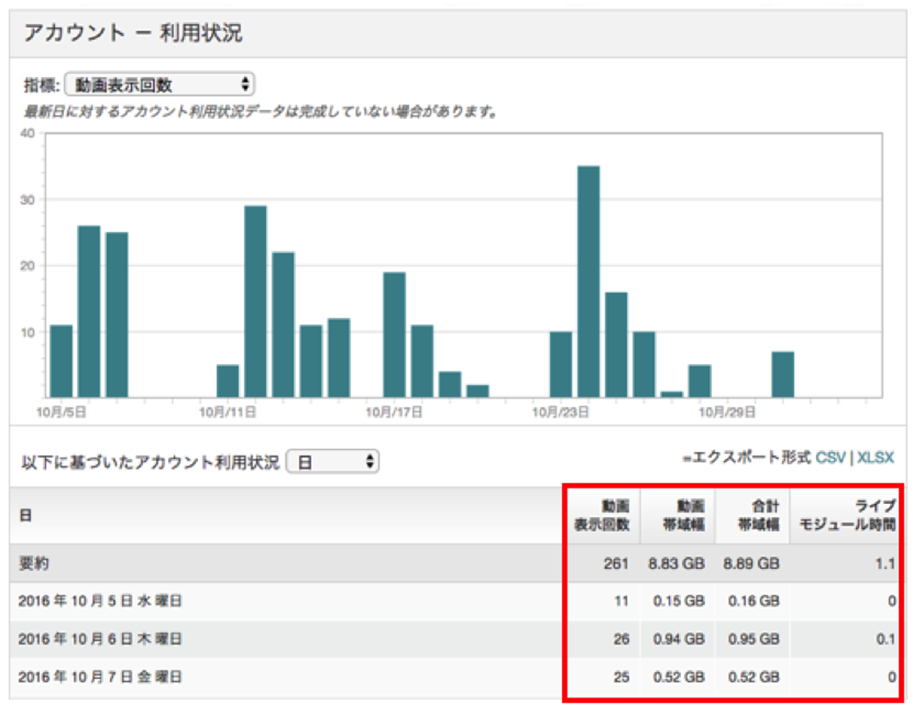
Customers who have been using Video Cloud since before 2015 have been able to check the number of views, CDN traffic, and Live module time on a management screen like the one below.

For customers who have been using the service for some time, this will be the Analytics module screen that you are familiar with, but just in case, here is a brief explanation
– __Video Views__: Number of times the video has been played (We apologize for the errors in the Japanese translation that have not been corrected)
– __Video Bandwidth__: CDN bandwidth used for video only
– __Total Bandwidth__: CDN bandwidth used for video, thumbnails and player
– __Live Module Time__: Time spent using the Live module
However, due to circumstances beyond our control, the Analytics screen and other management screens (legacy Studio) will no longer be available at the end of December 2016.
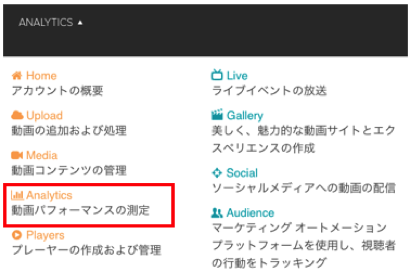
As a result, you will need to use the new Video Cloud Studio (management screen), and in this article we will explain how you can check the number of views, CDN traffic, and Live module time in the new Video Cloud Studio.
## 1. Number of Views
You can check the number of views and CDN traffic just as easily as before. First, we’ll explain how to check the number of views.
Please log in to the new Video Cloud control panel and select “Analytics”.
You can check the number of times a video has been played by selecting the number of times it has been displayed in the pull-down menu. (We apologize that the number of times a video has been displayed is still referred to as the number of times a video has been played in the new environment, but this is what we mean by the number of times a video has been played.
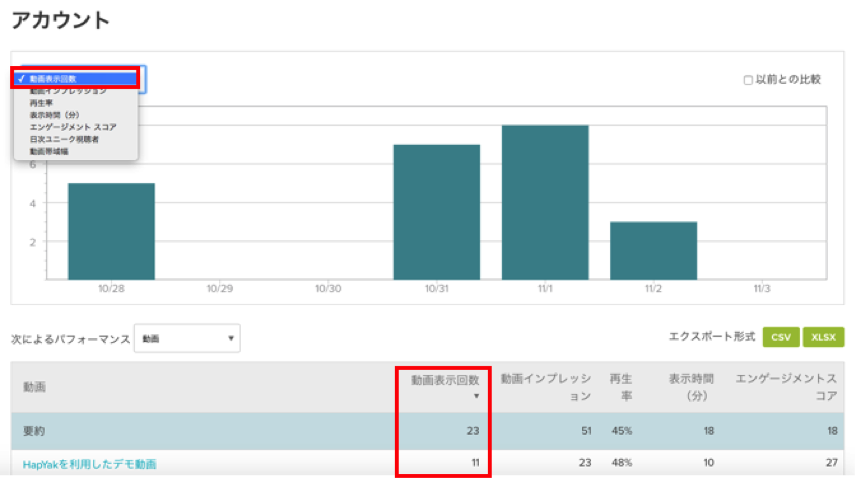
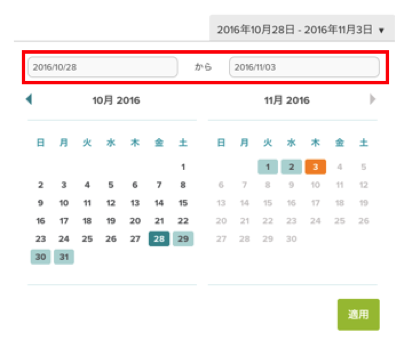
If you click on the date button in the top right, you can check the number of times the video has been played over a specified period.
## 2. CDN Traffic
Next, the CDN traffic volume is also relatively easy to check.
If you select “Video Bandwidth” from the pull-down menu, you can check the traffic volume.
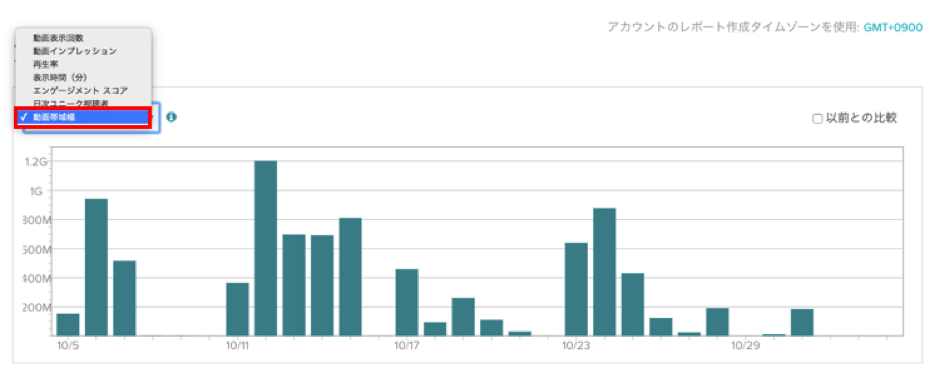
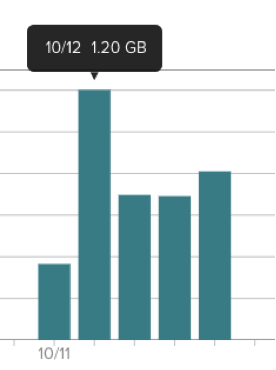
The CDN traffic per day is displayed when you mouse over it.
However, it is not possible to check the total (for example, monthly) CDN traffic.
If you add up the figures for each day, you can get an idea of the approximate flow, but it’s a bit of a hassle…
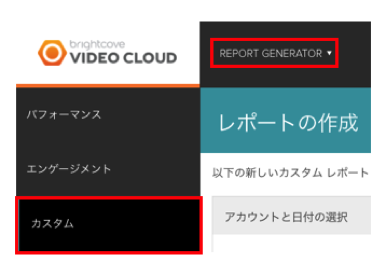
So, we recommend using the Report Generator in the Analytics function.
After moving to the Analytics screen, click on “Custom” at the far left.
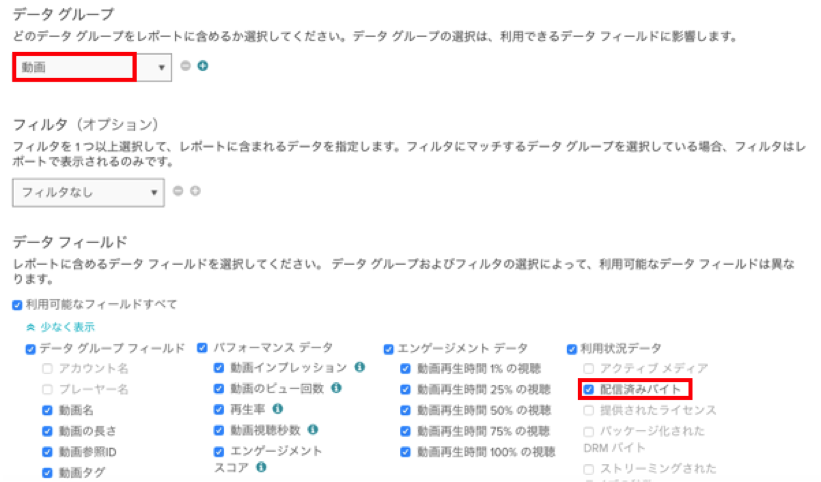
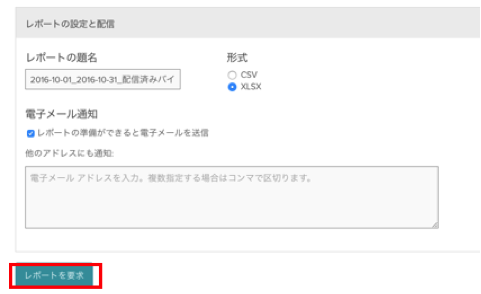
After that, please check that “Bytes delivered” is selected in the data field.
After checking, please enter the report title (file name) in “Report settings and delivery”, select whether to download in CSV or XLSX format, and then click the “Request report” button.
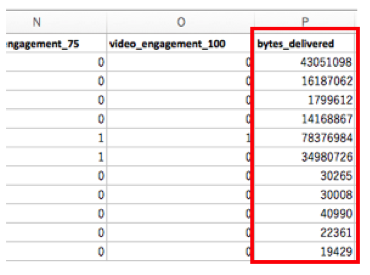
When you open the report, you can check the CDN traffic for each video as follows.
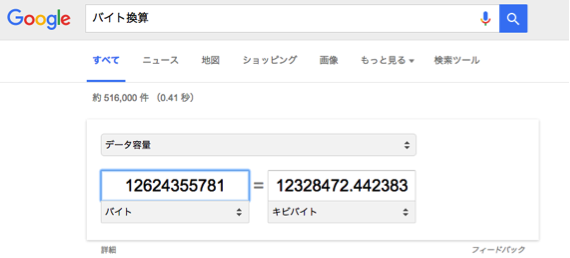
However, as this is expressed in bytes, you will need to convert it to gigabytes using a byte conversion tool or similar.
The easiest way to do this is to enter “byte conversion” into the search engine “Google”.
Unfortunately, the above is only the flow rate for video (video bandwidth). At present, it is not possible to obtain information on total bandwidth.
## 3. Live Module Time
You can check the Live Module Time in the same way as the CDN flow rate using the Report Generator.
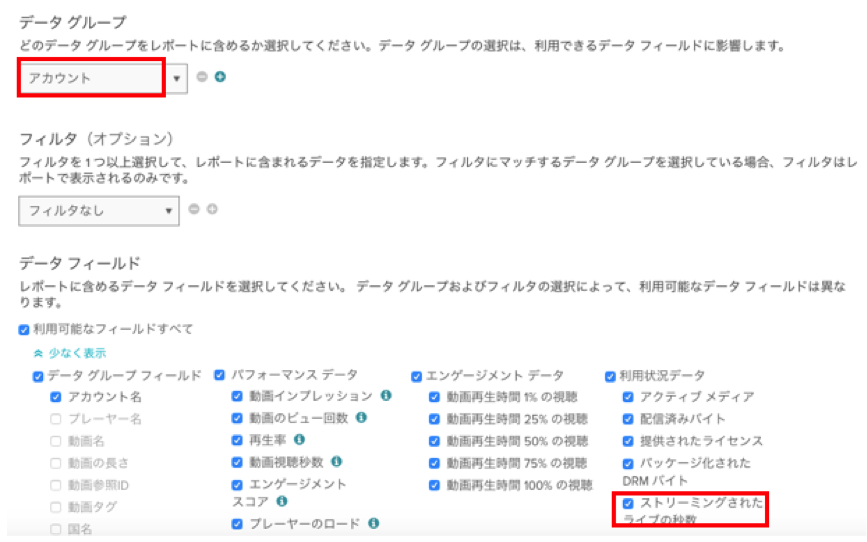
Please select your “Account” under “Data Group”. After that, please check that the “Number of Seconds of Live Streaming” box is checked, and then click “Request Report”.
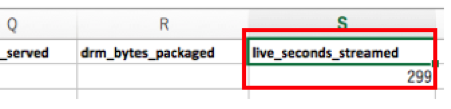
You can check the number of seconds used for “live_seconds_streamed” as shown below.
That’s all there is to it.
We know that many of our customers will be unhappy about the extra work involved, but we are planning to introduce a feature that will allow you to visually check your usage on the “Billing” screen around March 2017. Until then, we ask for your patience with the method described above.
*The Report Generator function cannot be used by VMS3.0 Starter I or II customers.


